File list
From Sean_Carver
This special page shows all uploaded files.
First page |
Previous page |
Next page |
Last page |
| Date | Name | Thumbnail | Size | User | Description | Versions |
|---|---|---|---|---|---|---|
| 23:49, 9 April 2015 | Math211 2015S HW21.pdf (file) | 40 KB | Carver | 1 | ||
| 04:30, 5 November 2014 | Longleaf1.xls (file) | 41 KB | Carver | 1 | ||
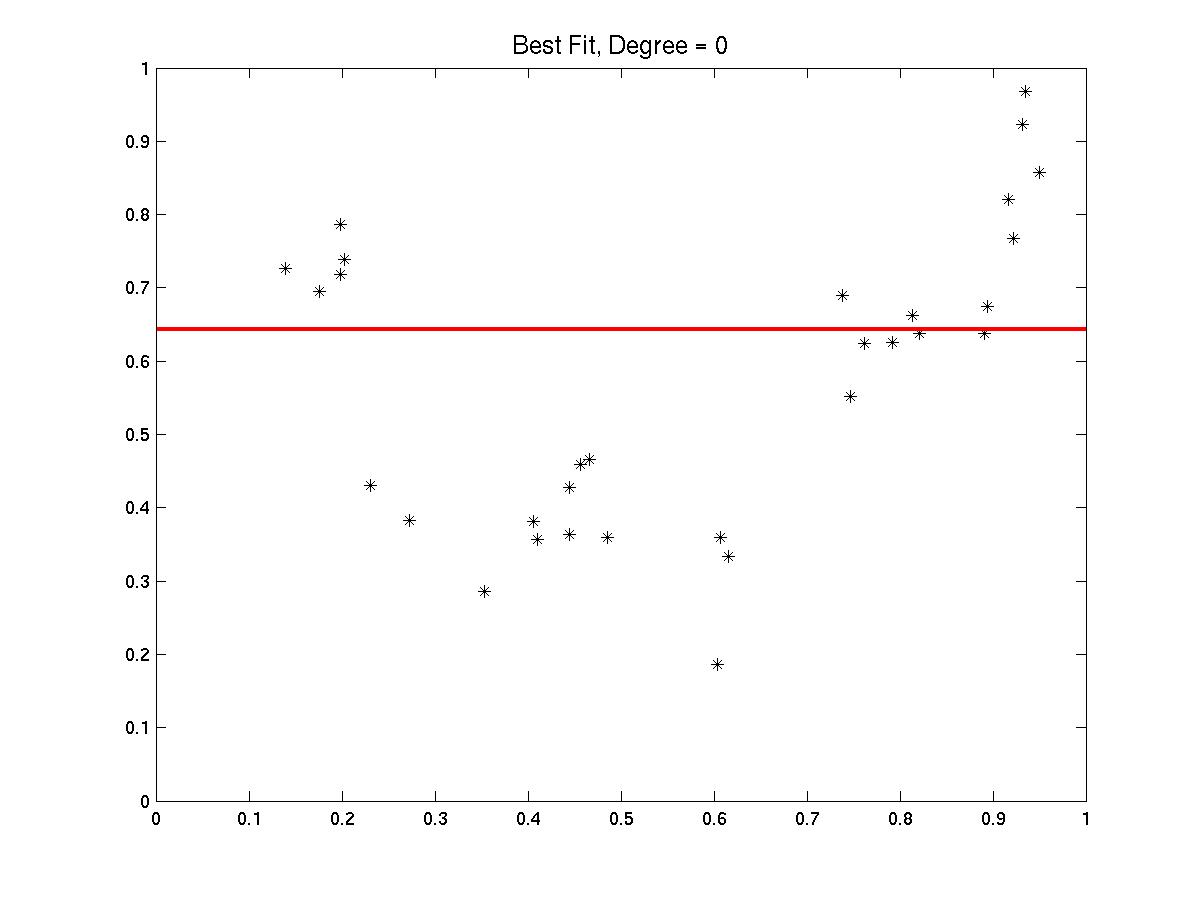
| 21:23, 22 April 2009 | Degree0.jpg (file) |  |
44 KB | Carver | Degree 0 fit to noisy parabolic data. | 1 |
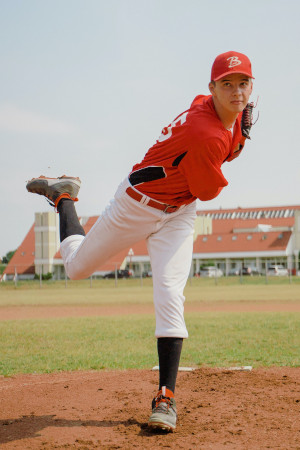
| 21:05, 4 November 2023 | Pexels-baseball-pitch-tima-miroshnichenko.jpg (file) |  |
44 KB | Carver | Photo by Tima Miroshnichenko | 1 |
| 13:04, 11 February 2015 | Stat202Exam1Practice2.pdf (file) | 44 KB | Carver | 1 | ||
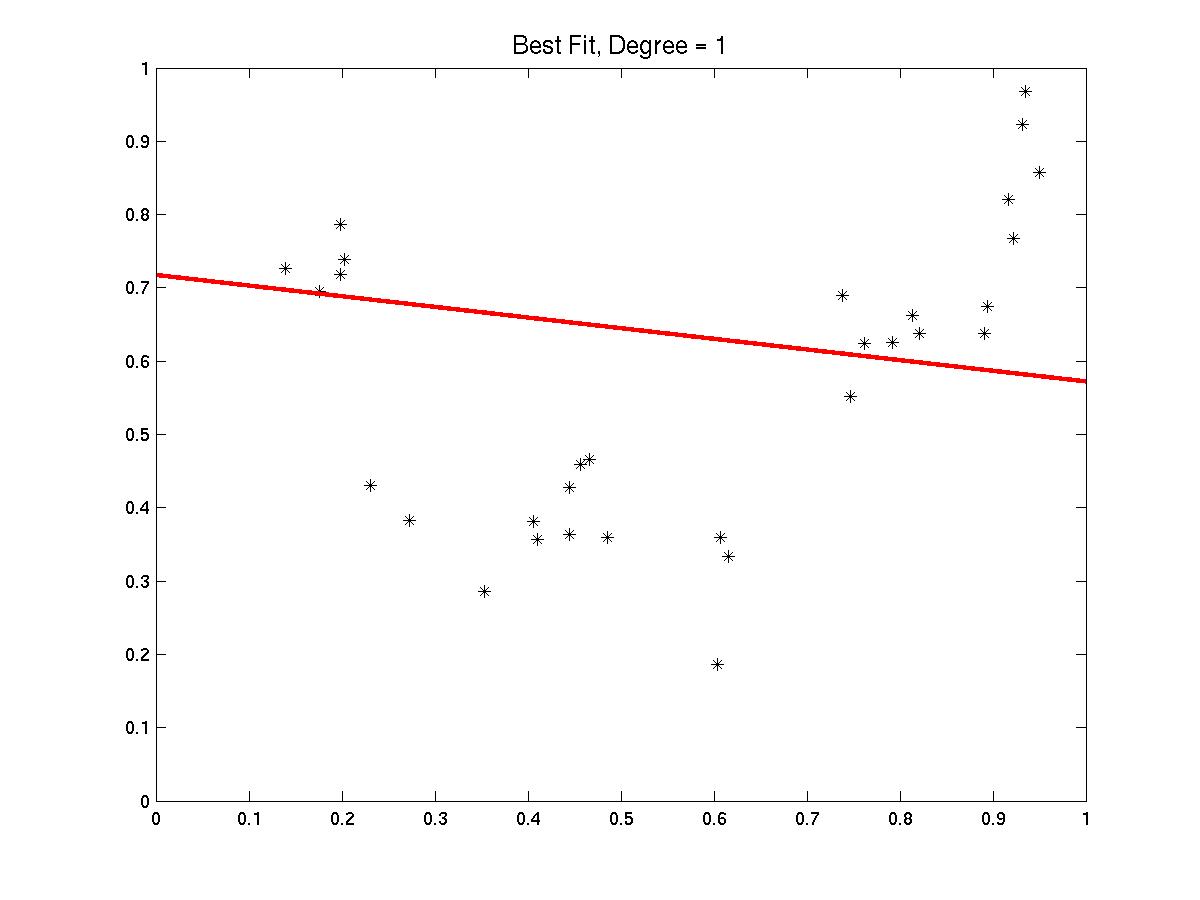
| 21:24, 22 April 2009 | Degree1.jpg (file) |  |
45 KB | Carver | Degree 1 fit to noisy parabolic data. | 1 |
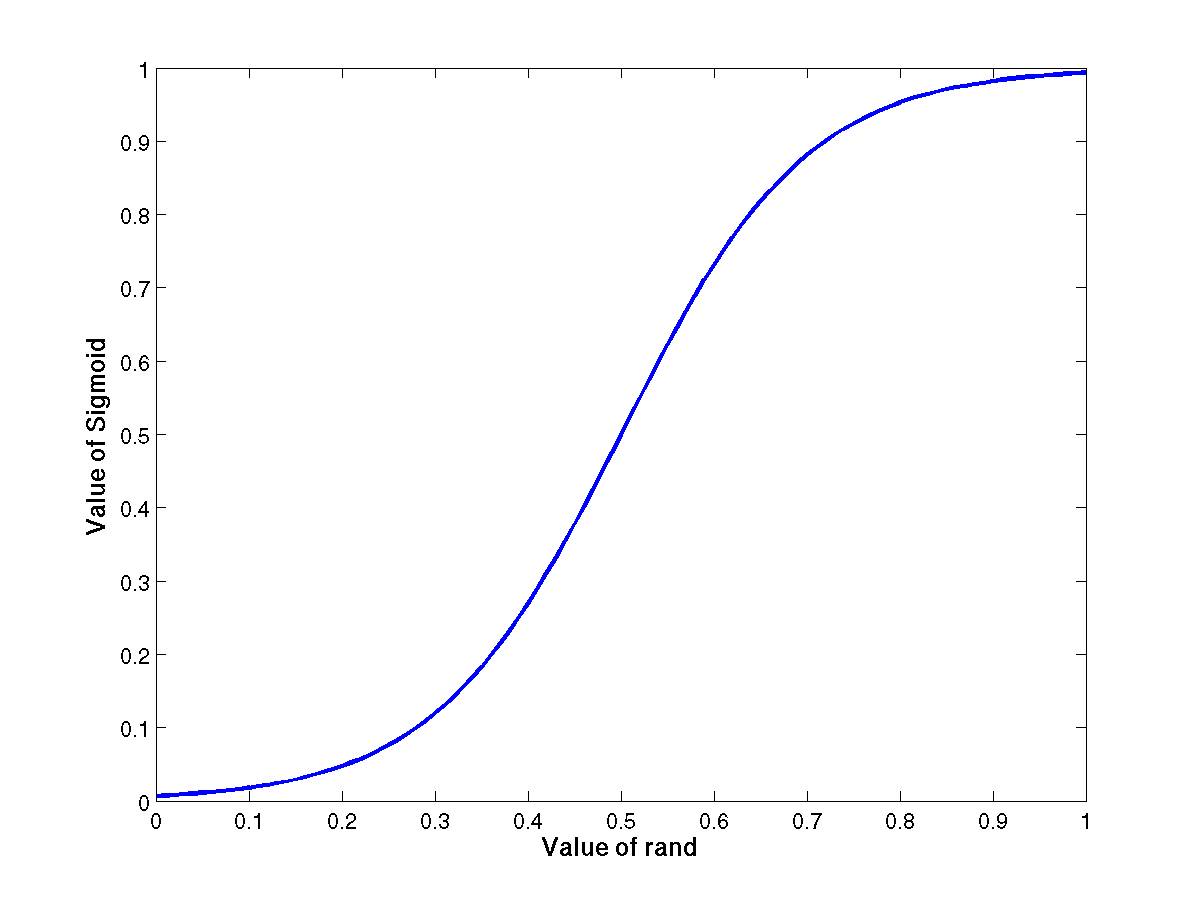
| 18:01, 3 February 2009 | Sigmoid.jpg (file) |  |
45 KB | Carver | Sigmoid function | 1 |
| 23:56, 14 January 2016 | Worksheet 1A.pdf (file) | 46 KB | Carver | 1 | ||
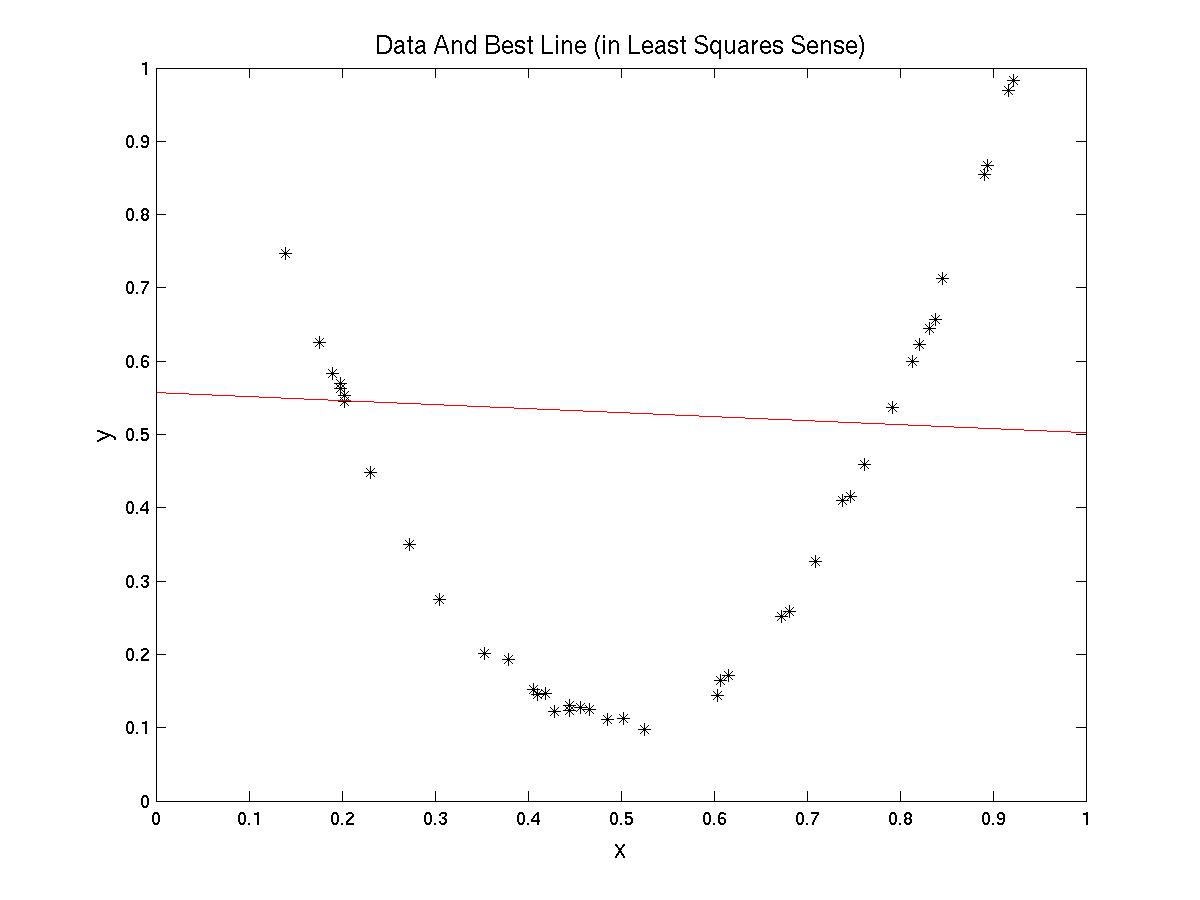
| 21:59, 20 April 2009 | DataBestParab.jpg (file) |  |
46 KB | Carver | Best Line fitting Parabola Data (LS-Best) | 1 |
| 23:57, 10 January 2020 | Q1Banner.jpg (file) | 46 KB | Carver | 1 | ||
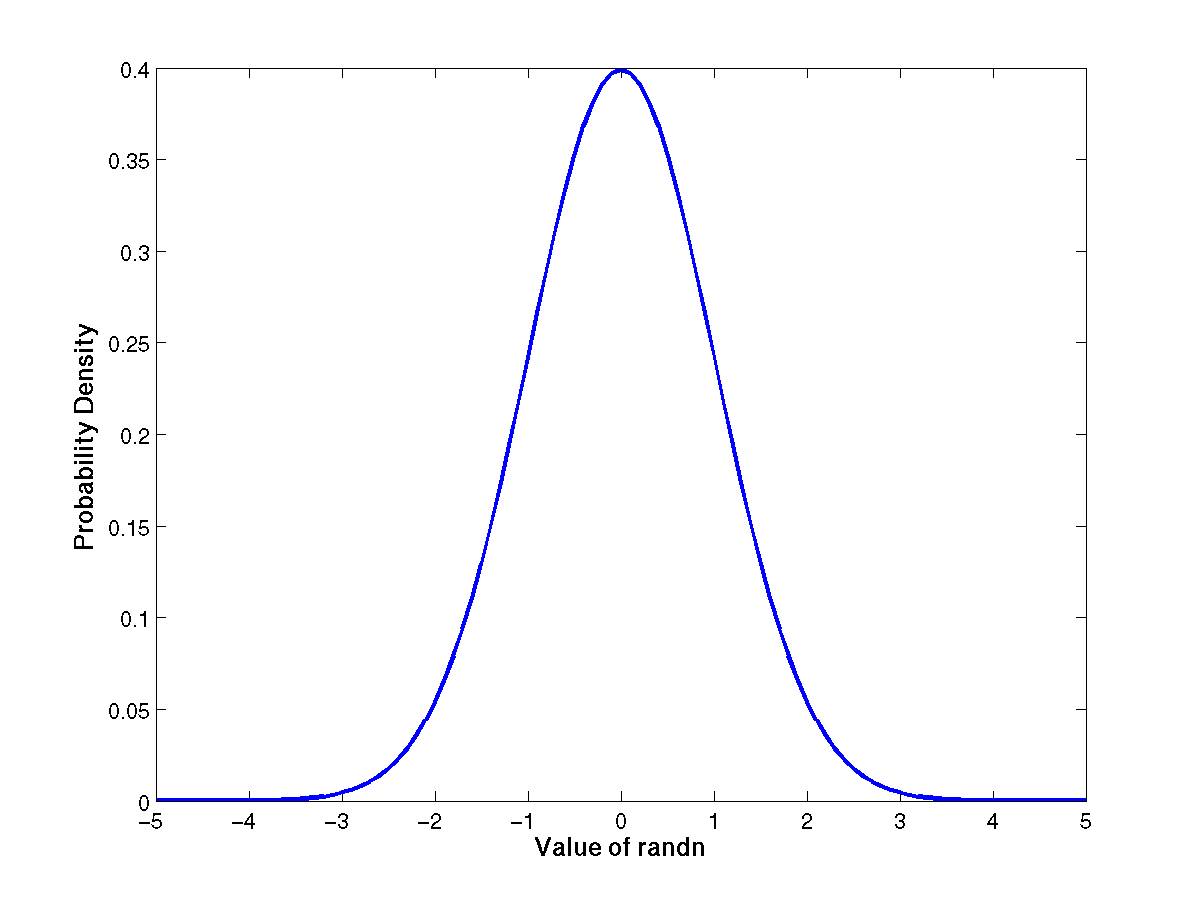
| 16:44, 2 February 2009 | Randnpdf.jpg (file) |  |
48 KB | Carver | Probability Density Function for randn | 1 |
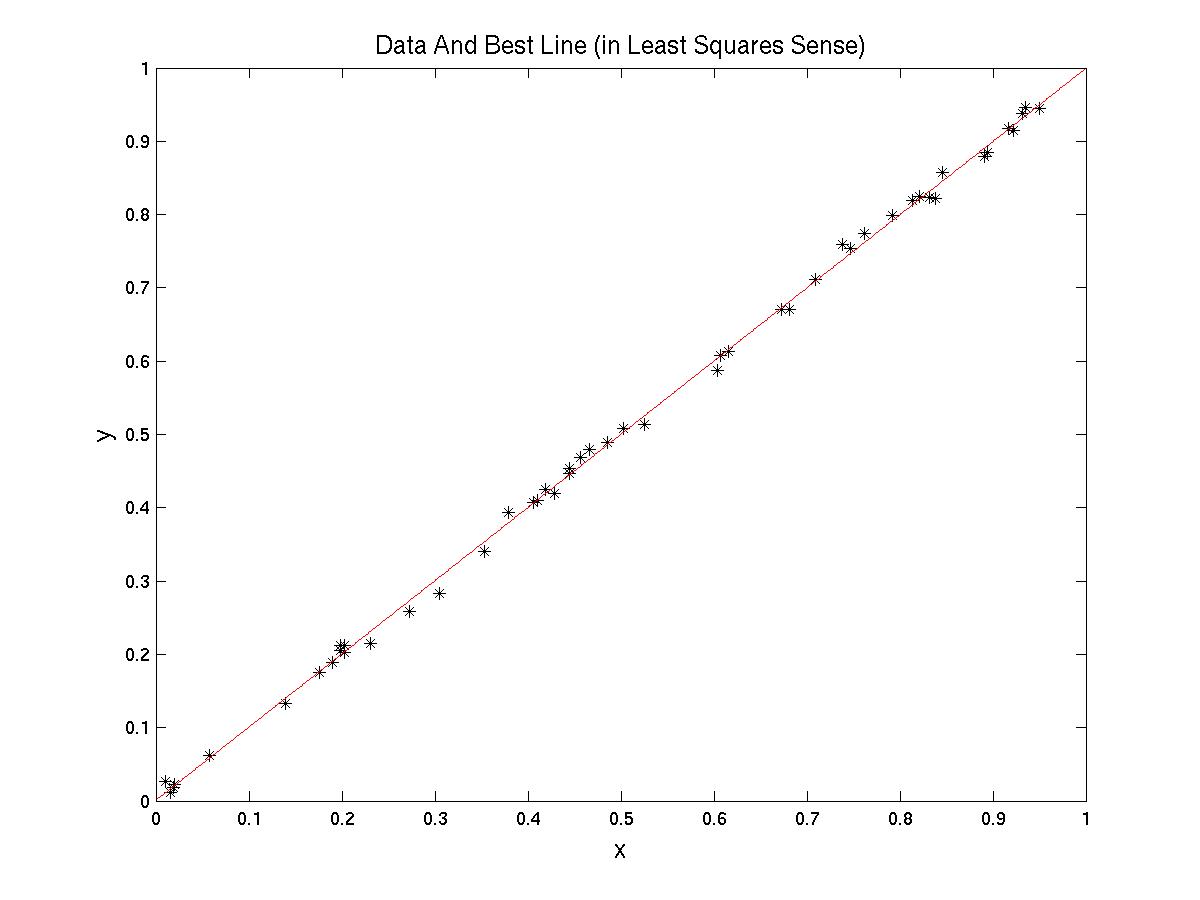
| 21:57, 20 April 2009 | DataBestLine.jpg (file) |  |
48 KB | Carver | Line Data with Best Line (LS). | 1 |
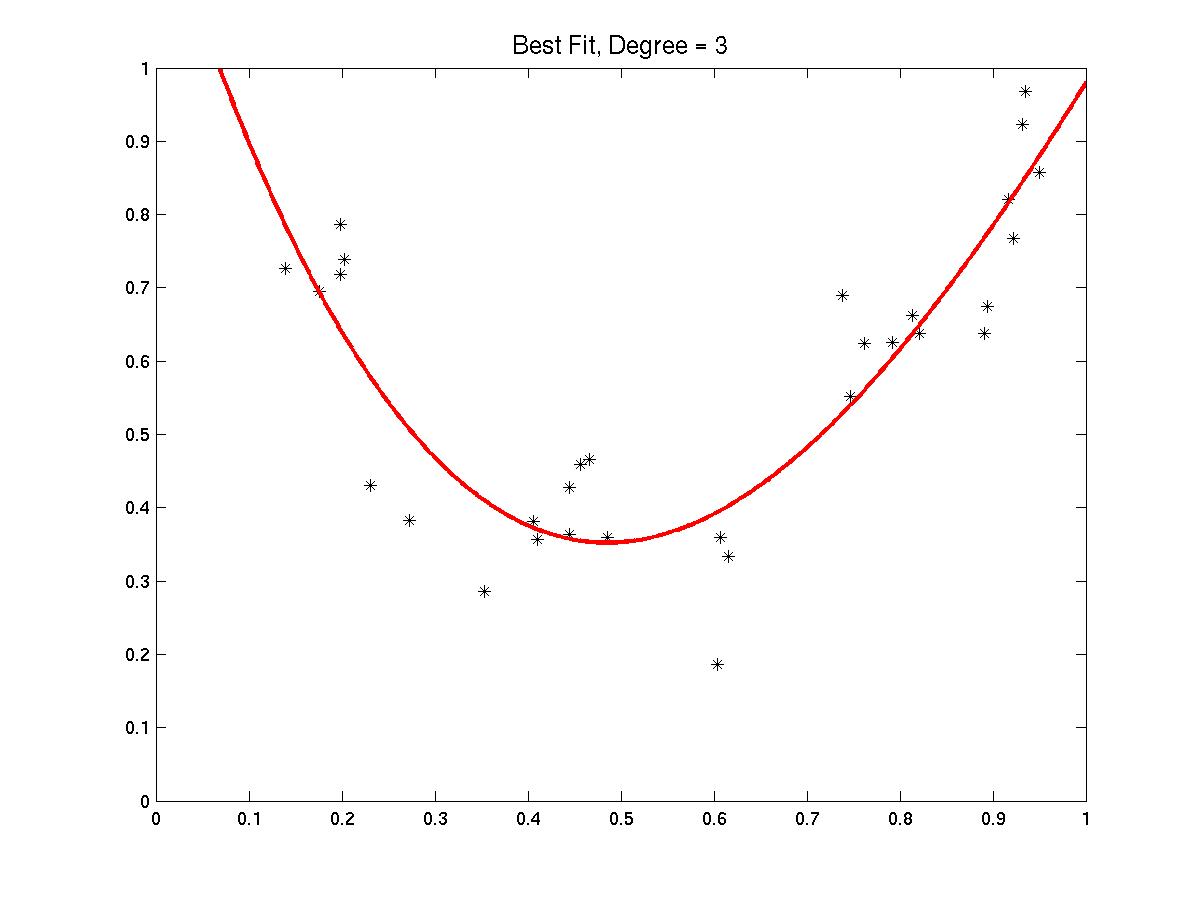
| 22:18, 22 April 2009 | Degree3.jpg (file) |  |
49 KB | Carver | Degree 3 fit to noisy parabolic data. | 1 |
| 21:50, 4 March 2015 | Math211 2015S HW18.pdf (file) | 50 KB | Carver | 1 | ||
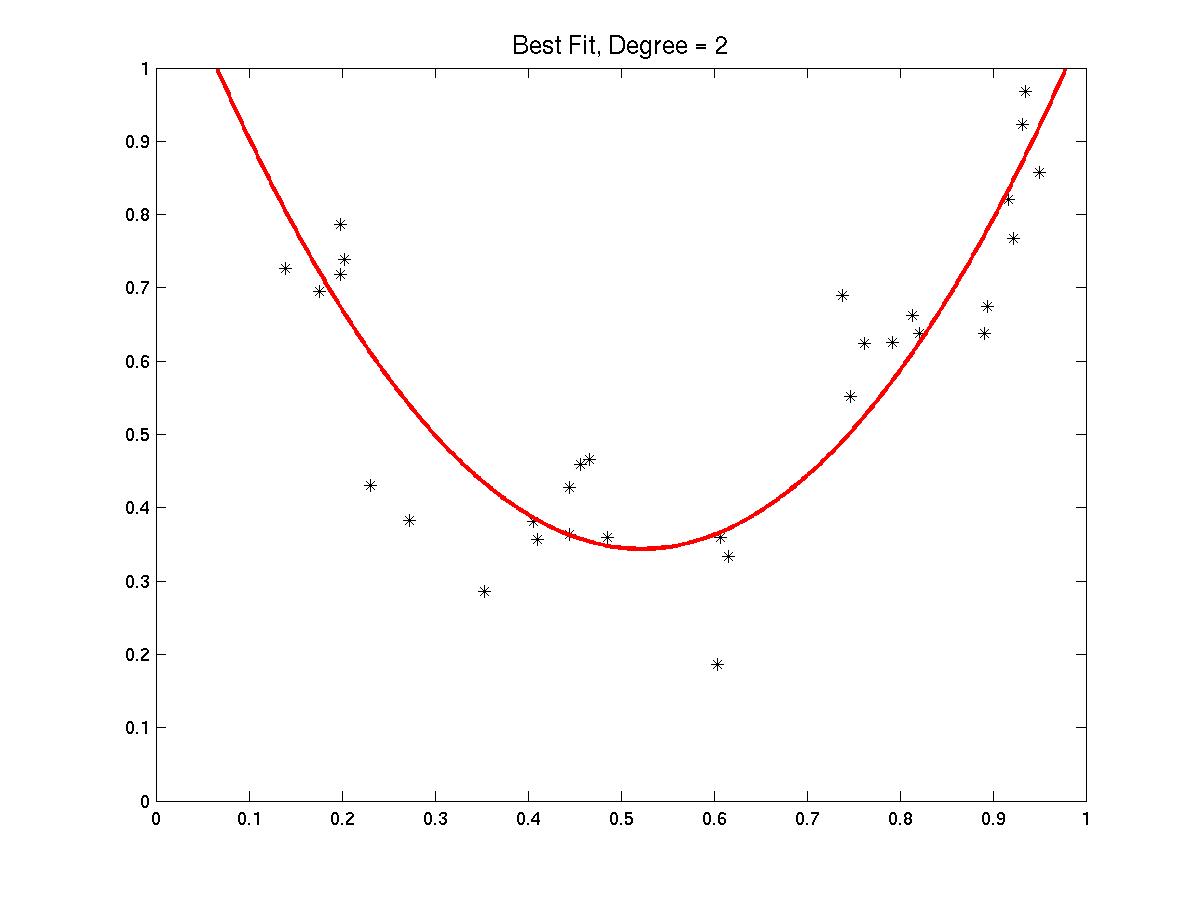
| 21:27, 22 April 2009 | Degree2.jpg (file) |  |
50 KB | Carver | Degree 2 fit to noisy parabolic data. | 1 |
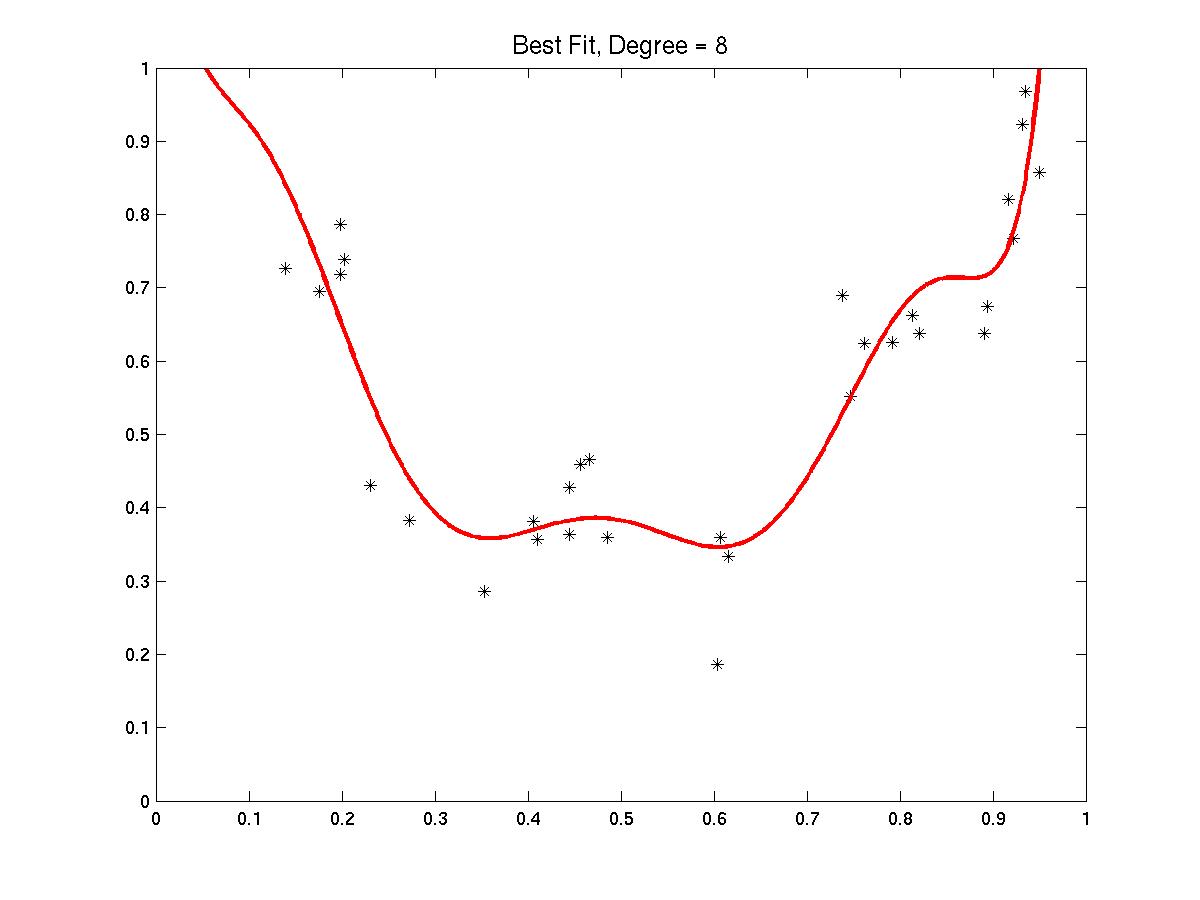
| 22:28, 22 April 2009 | Degree8.jpg (file) |  |
50 KB | Carver | Degree 8 fit to noisy parabolic data. | 1 |
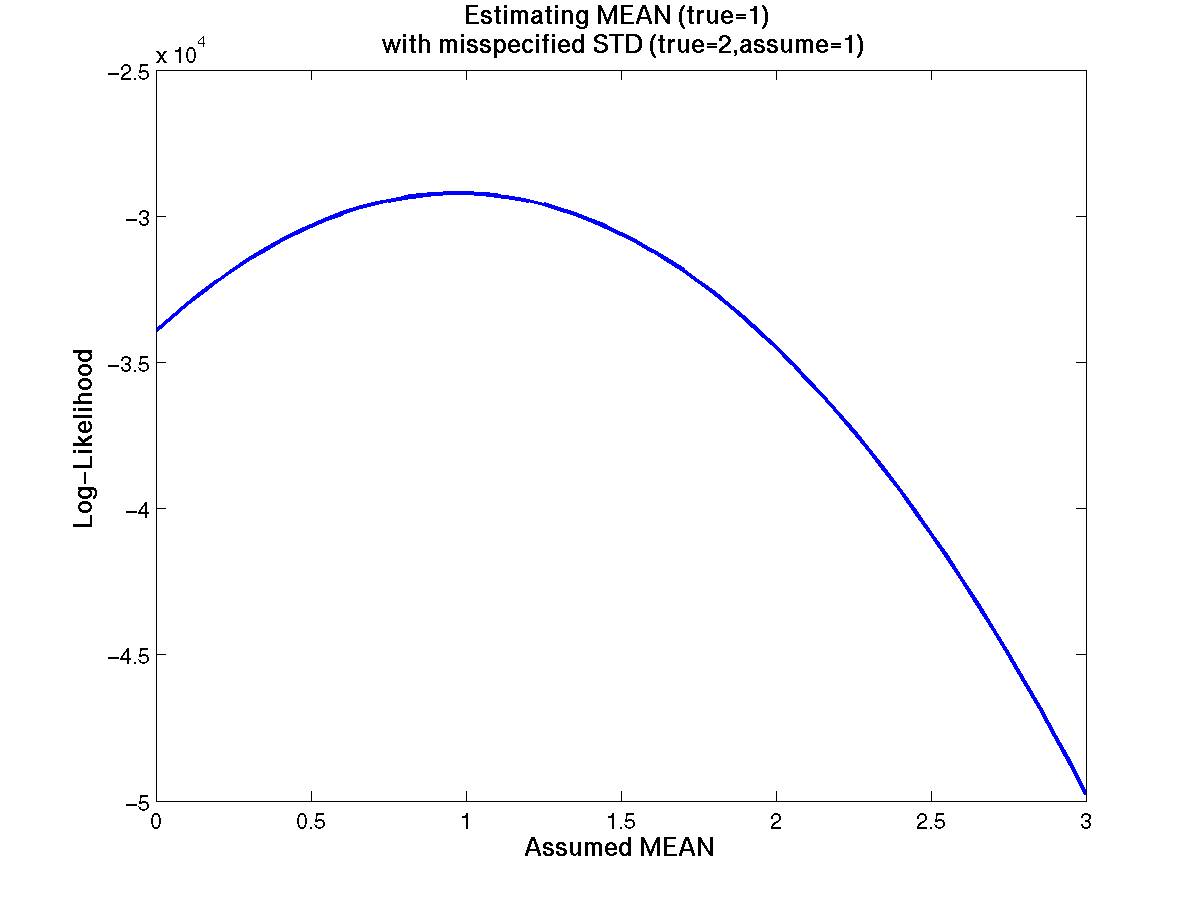
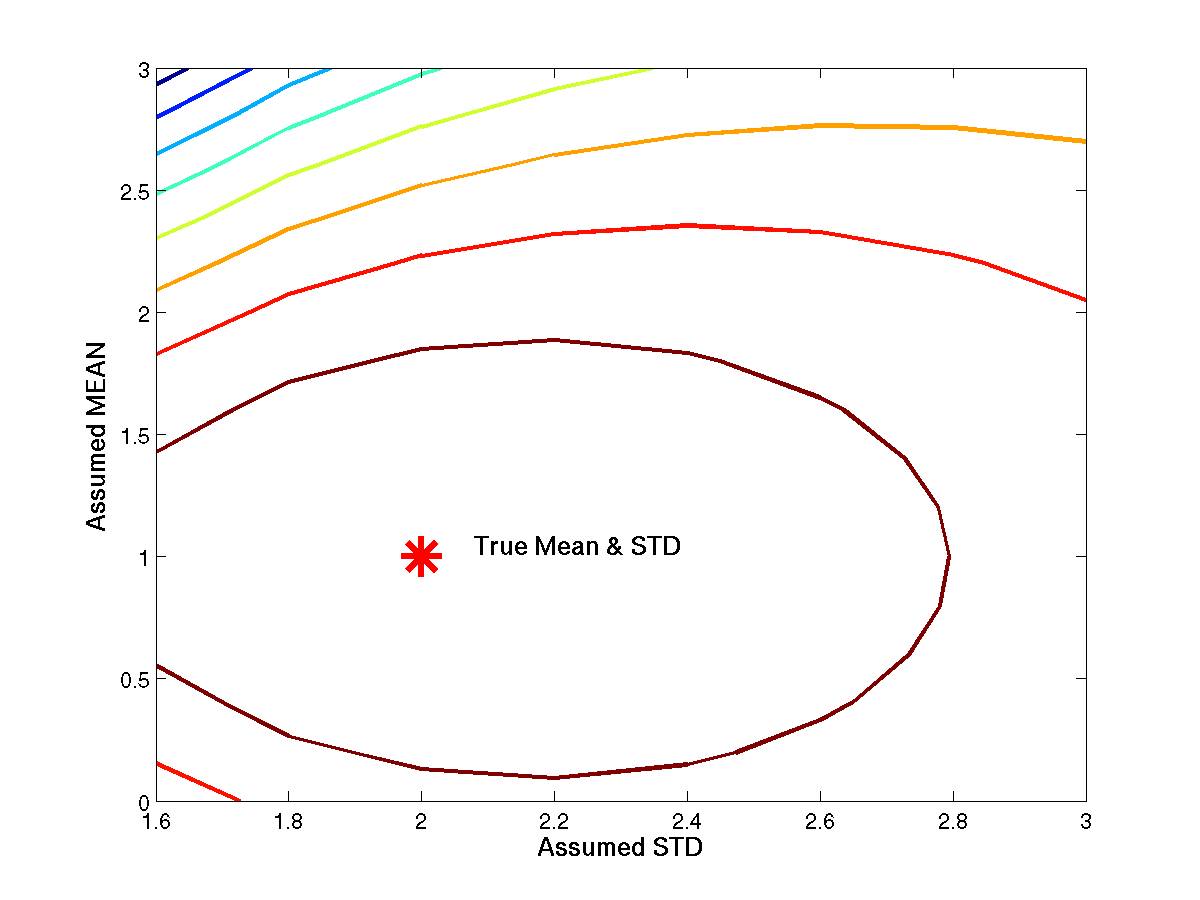
| 00:23, 3 February 2009 | Emeanmis.jpg (file) |  |
50 KB | Carver | Likelihood to estimate mean with misspecified standard deviation. | 1 |
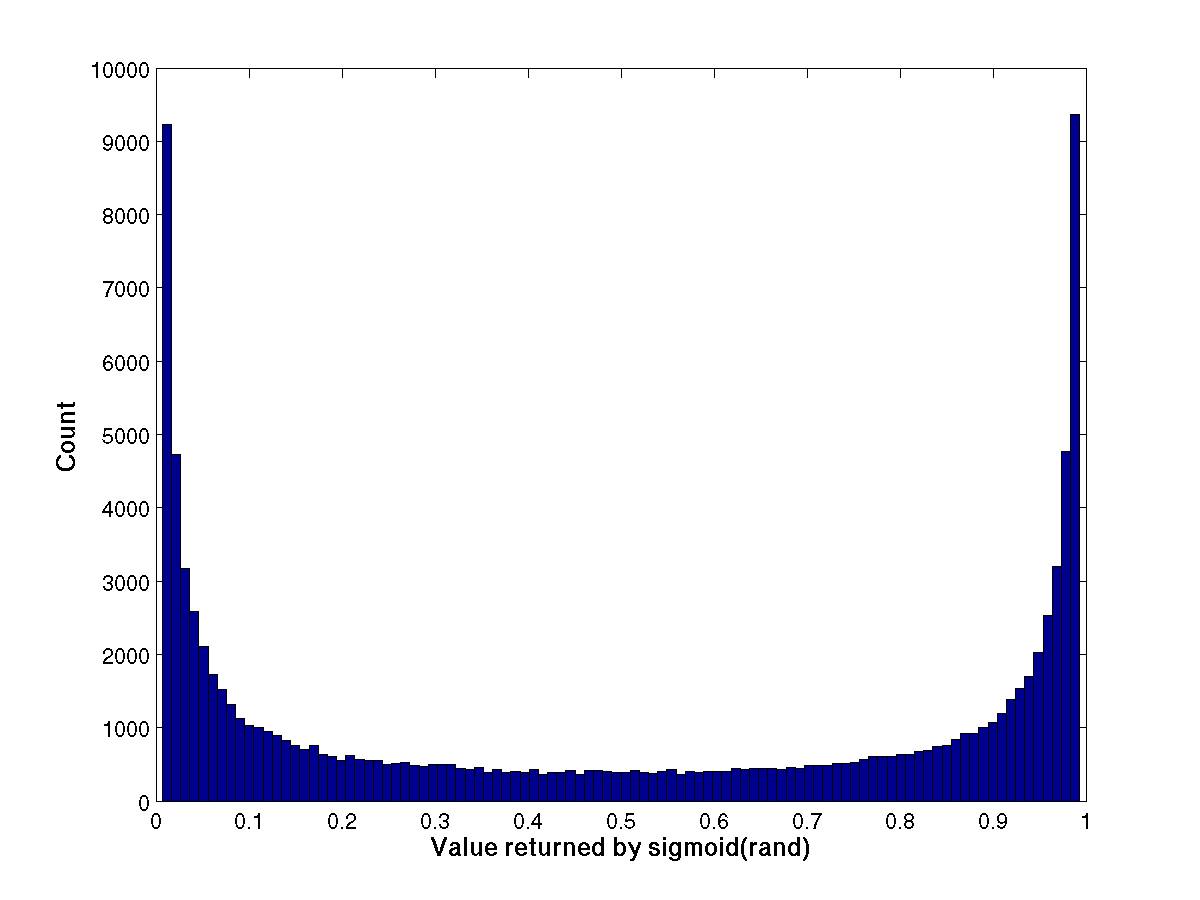
| 01:57, 3 February 2009 | Sighist.jpg (file) |  |
52 KB | Carver | Histogram of rand composed with a sigmoid function. | 1 |
| 18:44, 26 July 2016 | Stat202 T Stats.pdf (file) | 53 KB | Carver | 1 | ||
| 19:15, 8 September 2014 | Stat202Homework3Solutions.pdf (file) | 53 KB | Carver | 1 | ||
| 23:00, 7 September 2016 | Stat20X Week01 Practice Solutions.pdf (file) | 54 KB | Carver | 1 | ||
| 23:06, 14 April 2015 | Math211 2015S HW23.pdf (file) | 54 KB | Carver | 1 | ||
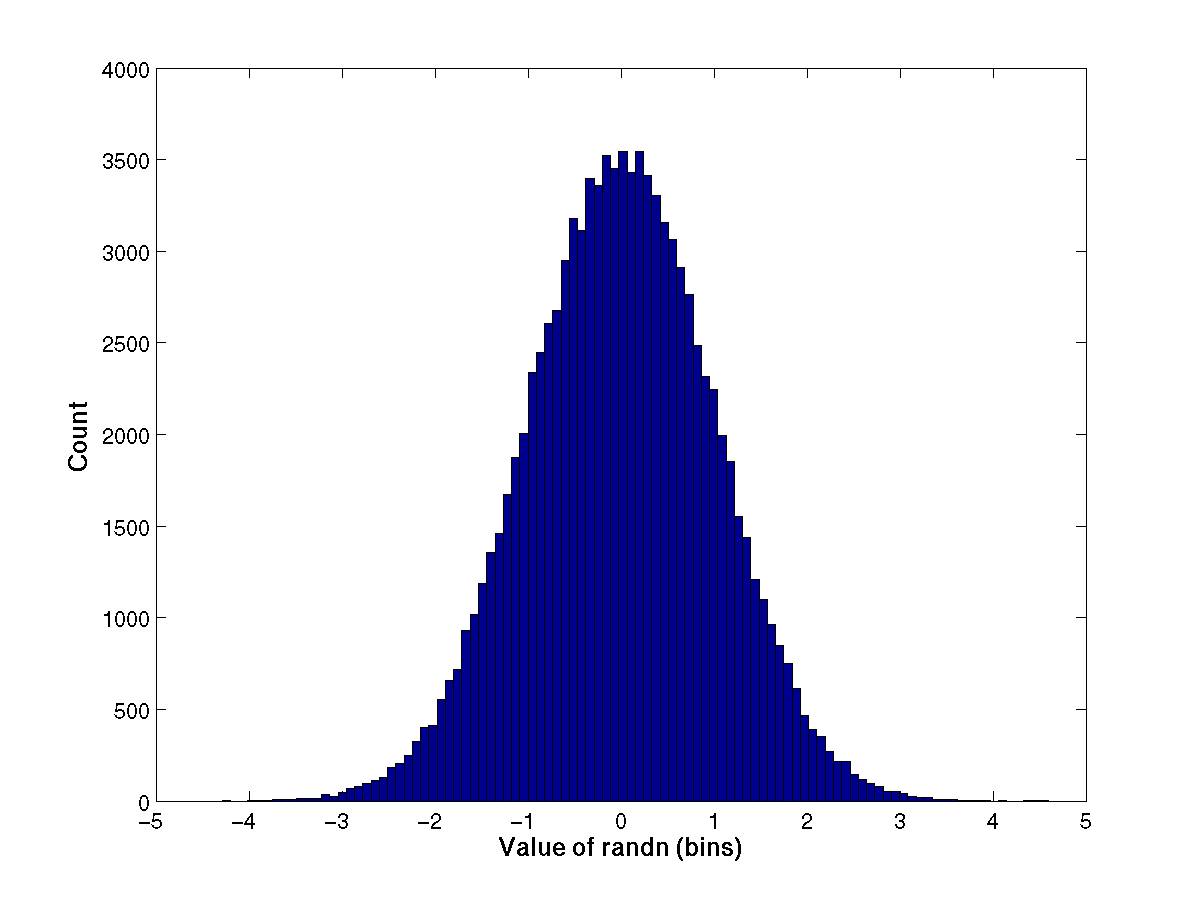
| 16:43, 2 February 2009 | Randnhist.jpg (file) |  |
54 KB | Carver | Histogram of randn | 1 |
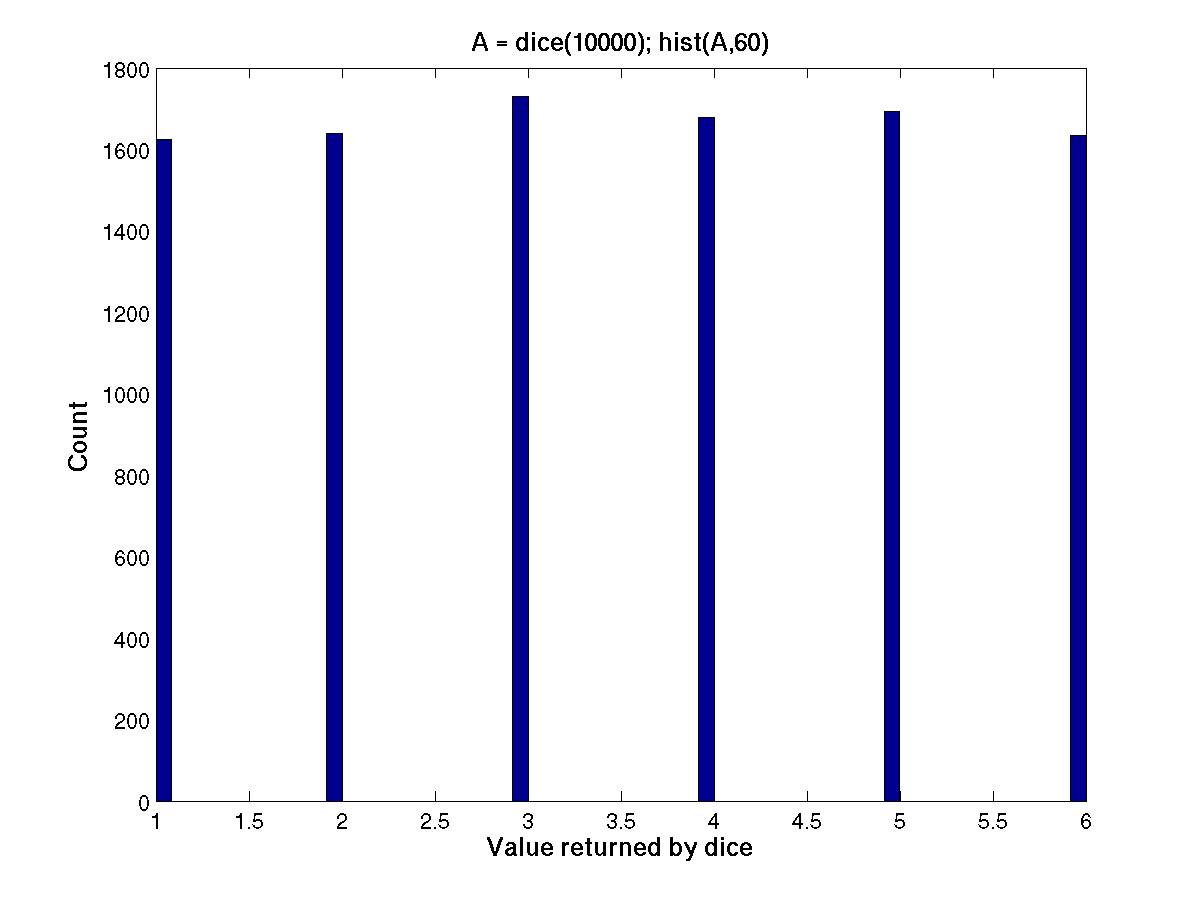
| 02:39, 3 February 2009 | Dicehist.jpg (file) |  |
54 KB | Carver | Histogram of rolling dice. | 1 |
| 23:16, 10 February 2015 | Stat202Exam1Practice1.pdf (file) | 55 KB | Carver | 1 | ||
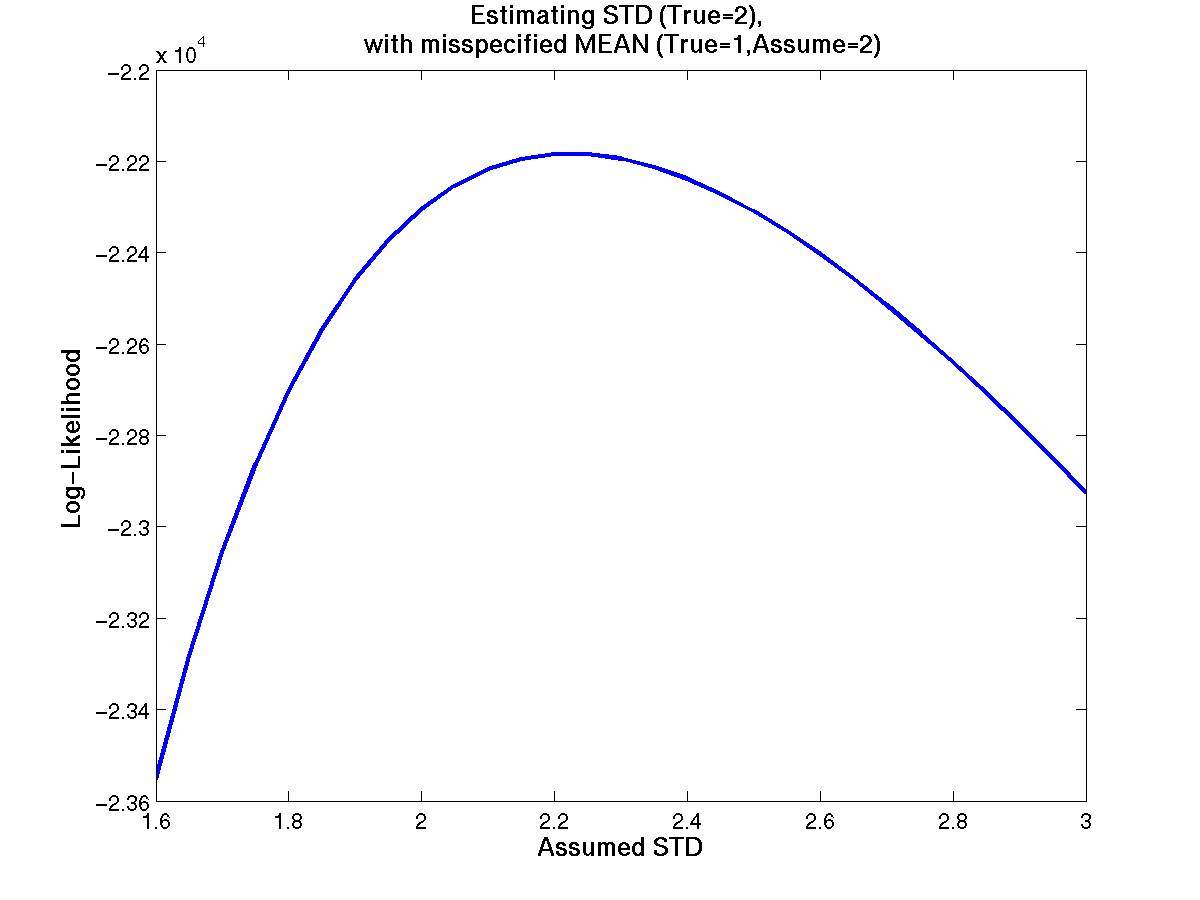
| 00:24, 3 February 2009 | Estdmis.jpg (file) |  |
56 KB | Carver | Likelihood to estimate standard deviation with misspecifed mean. | 1 |
| 00:26, 10 April 2015 | Stat202 2015S Lab1 Solutions.pdf (file) | 56 KB | Carver | 1 | ||
| 00:18, 11 April 2015 | Math211 2015S HW22.pdf (file) | 57 KB | Carver | 1 | ||
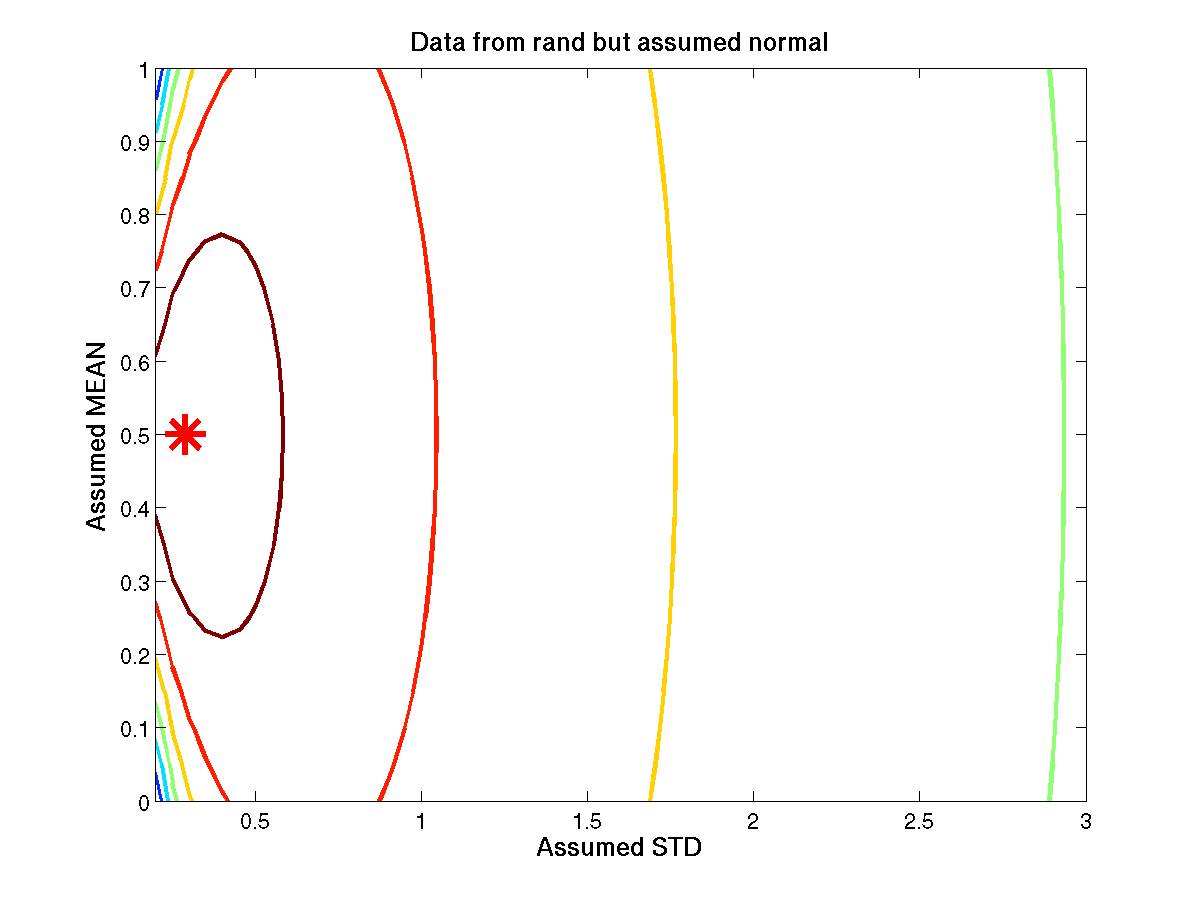
| 00:17, 3 February 2009 | Randcontour.jpg (file) |  |
57 KB | Carver | Contour plot of likelihood generated with data from rand assuming a normal model with unknown mean and standard deviation. | 1 |
| 01:47, 31 January 2015 | Math211 2015S HW11.pdf (file) | 59 KB | Carver | 1 | ||
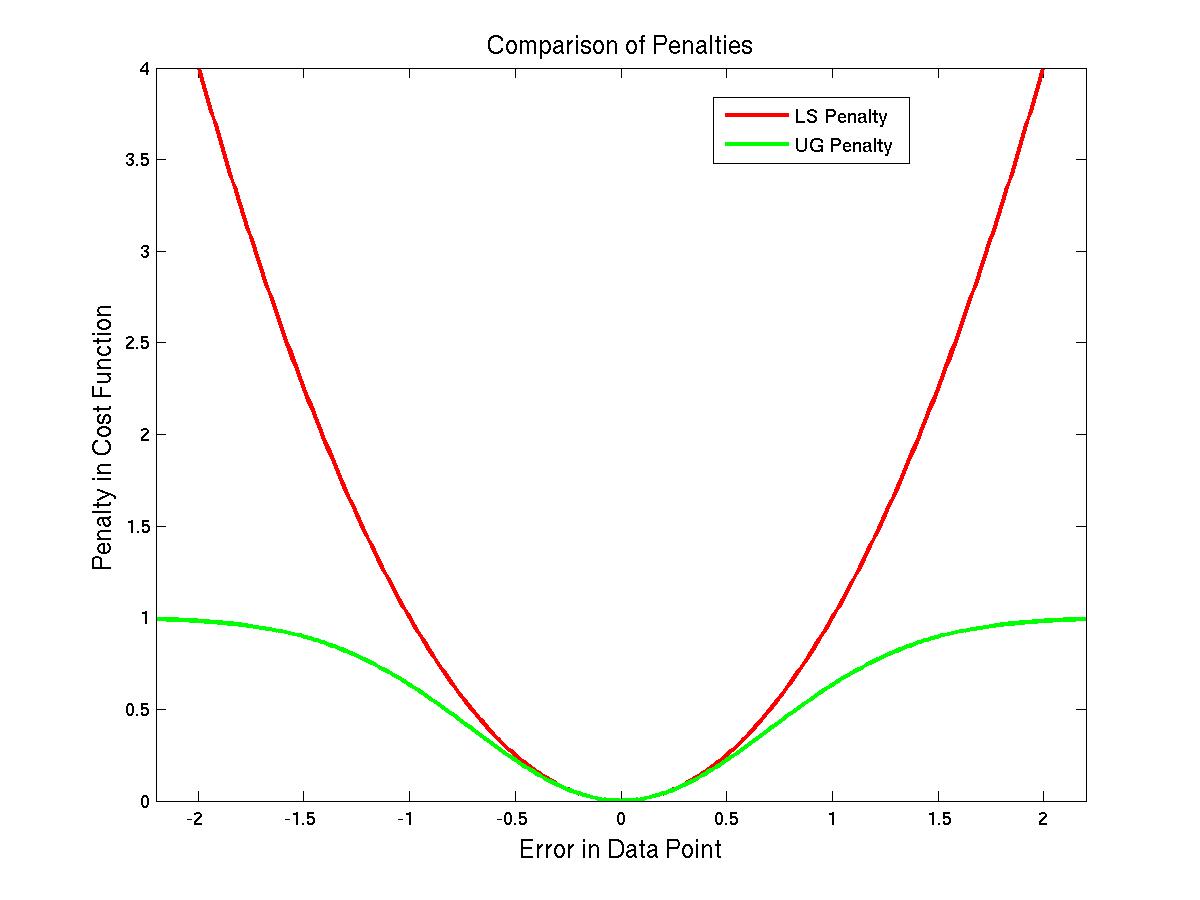
| 22:09, 20 April 2009 | ErrorPenalties.jpg (file) |  |
59 KB | Carver | Comparison of Penalty Function for Errors Fitting Data Points (Squared Error or Upside-Down Gaussian). | 1 |
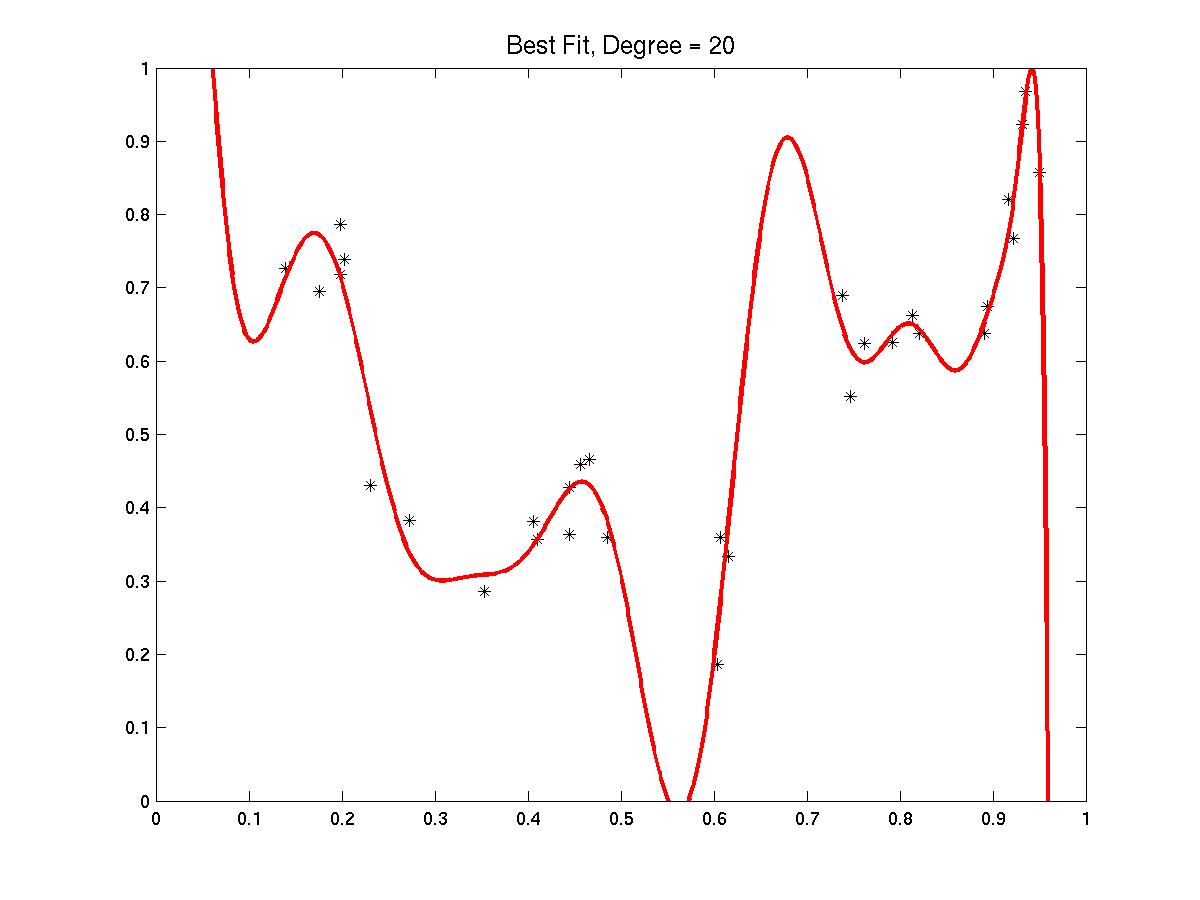
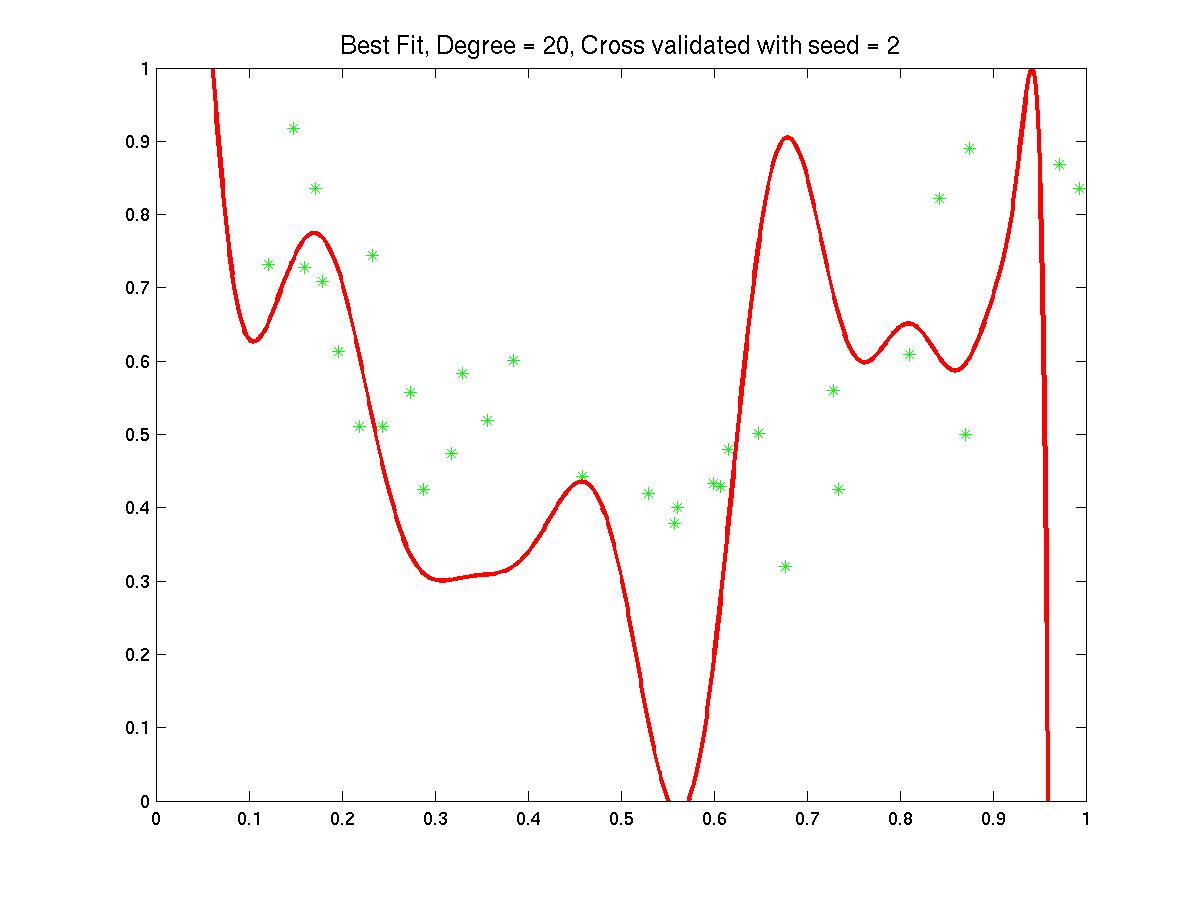
| 22:32, 22 April 2009 | Degree20.jpg (file) |  |
60 KB | Carver | Degree 20 fit to noisy parabolic data. | 1 |
| 01:25, 18 February 2020 | Exam1Spring2020ReviewSolutions.pdf (file) | 60 KB | Carver | 1 | ||
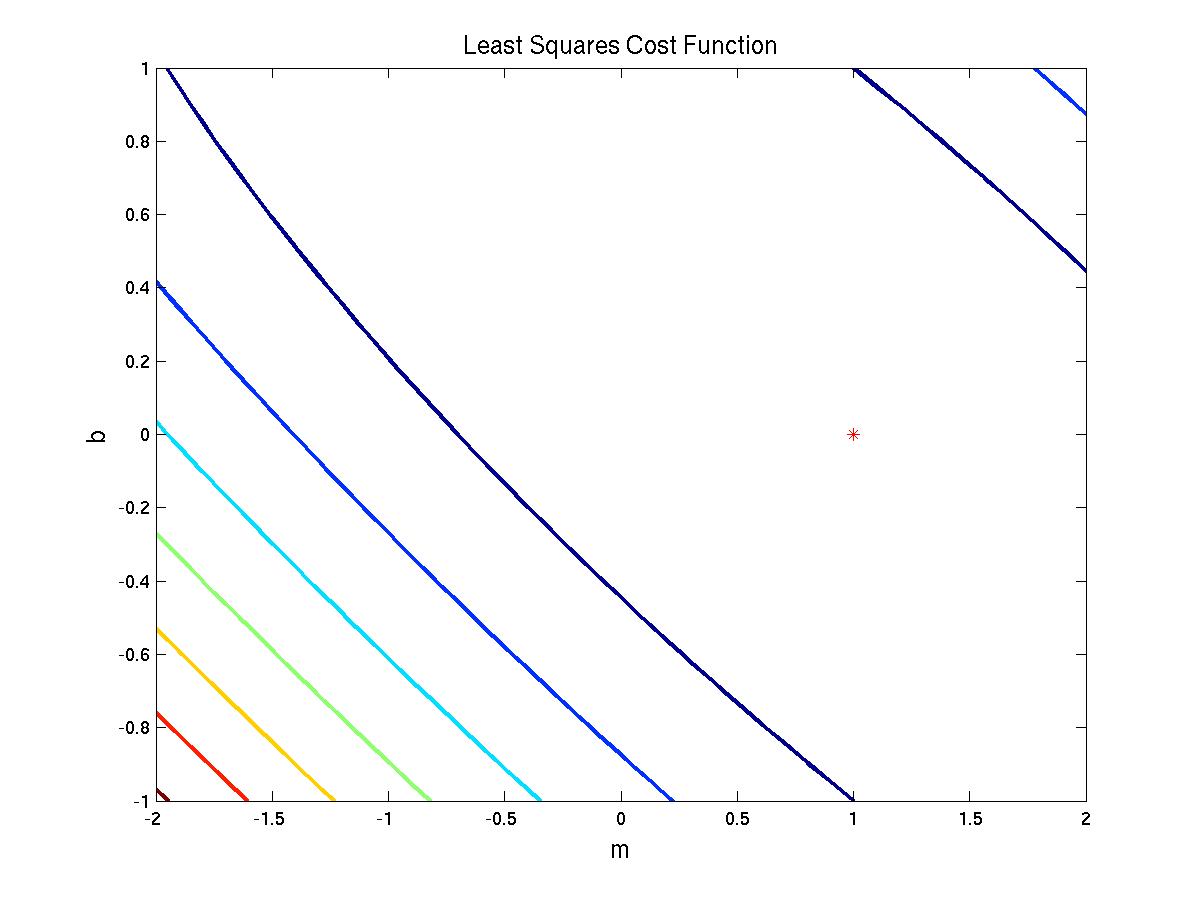
| 22:06, 20 April 2009 | CostBestLine.jpg (file) |  |
60 KB | Carver | LS-Cost Function for fitting a Line to nearly linear data. | 1 |
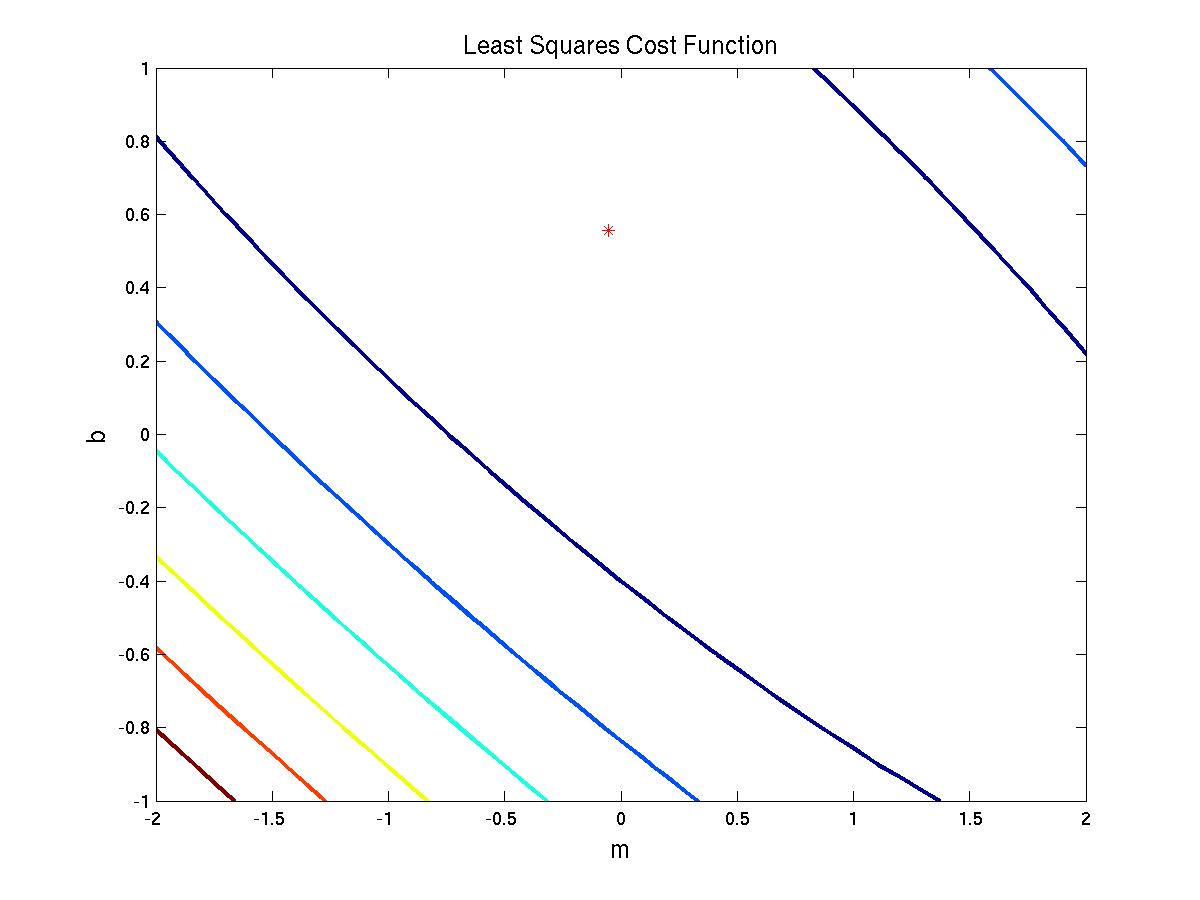
| 22:07, 20 April 2009 | CostBestParab.jpg (file) |  |
60 KB | Carver | LS-Cost function for fitting a line to nearly parabolic data. | 1 |
| 22:43, 2 February 2009 | Nmscontour.jpg (file) |  |
62 KB | Carver | Contour plot of the likelihood function for data generated by sampling a normal distribution with mean 1 and standard deviation 2, assuming a normal distribution with unknown mean and standard deviation as the model. | 1 |
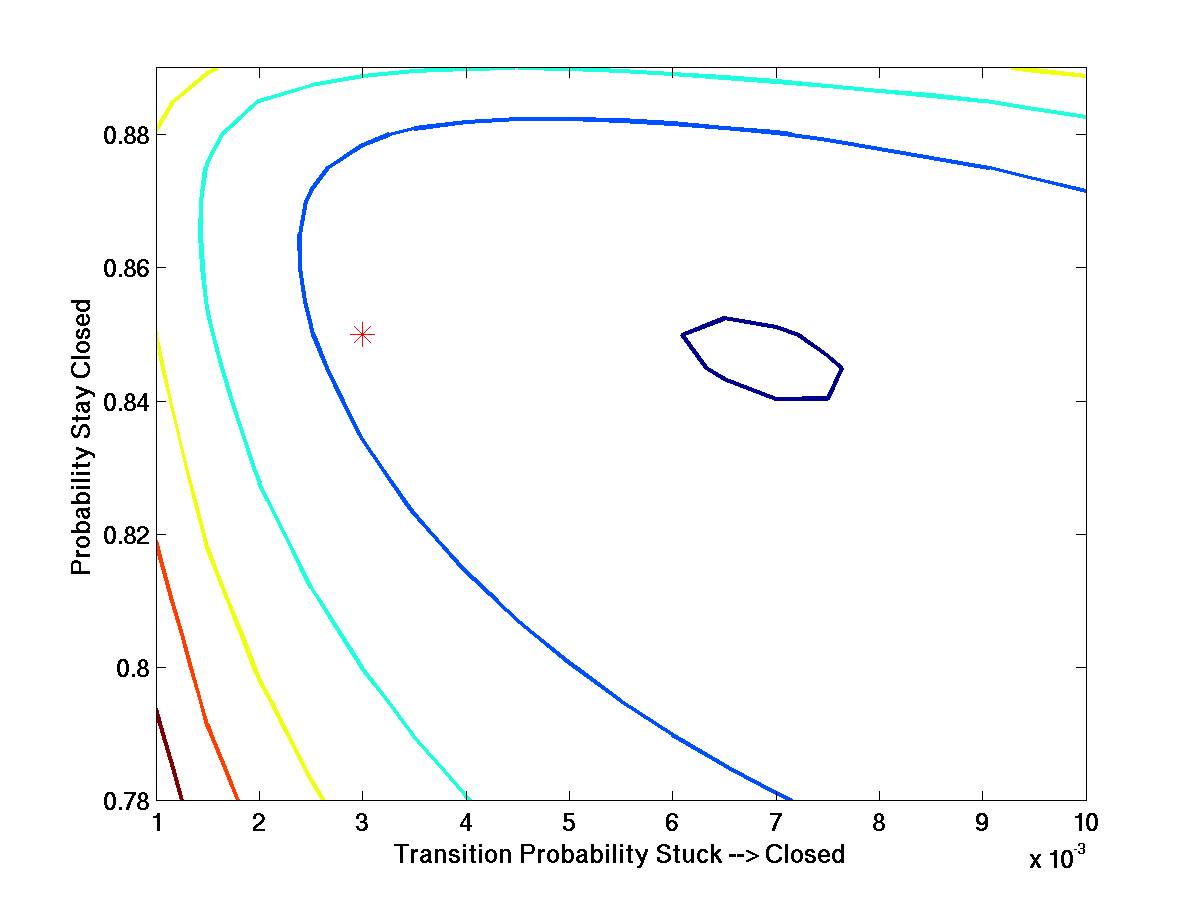
| 04:36, 8 April 2009 | Seed10Fit.jpg (file) |  |
62 KB | Carver | Fit to chan using seed=10 | 1 |
| 22:36, 22 April 2009 | CrossValid.jpg (file) |  |
64 KB | Carver | Cross validation of a 20 degree fit to noisy parabolic data. | 1 |
| 01:47, 31 January 2015 | Math211 2015S HW12.pdf (file) | 64 KB | Carver | 1 | ||
| 18:18, 22 January 2015 | Math211 2015S HW5.pdf (file) | 66 KB | Carver | 1 | ||
| 21:22, 29 January 2020 | FastFoodExploratory.pdf (file) | 69 KB | Carver | 1 | ||
| 01:47, 31 January 2015 | Math211 2015S HW10.pdf (file) | 73 KB | Carver | 1 | ||
| 19:44, 4 December 2014 | Stat202FinalPractice.pdf (file) | 73 KB | Carver | 1 | ||
| 13:15, 29 August 2016 | Election Day 2016 Data Collection.pdf (file) | 74 KB | Carver | 1 | ||
| 21:03, 30 January 2015 | Math211 2015S HW9.pdf (file) | 74 KB | Carver | 1 | ||
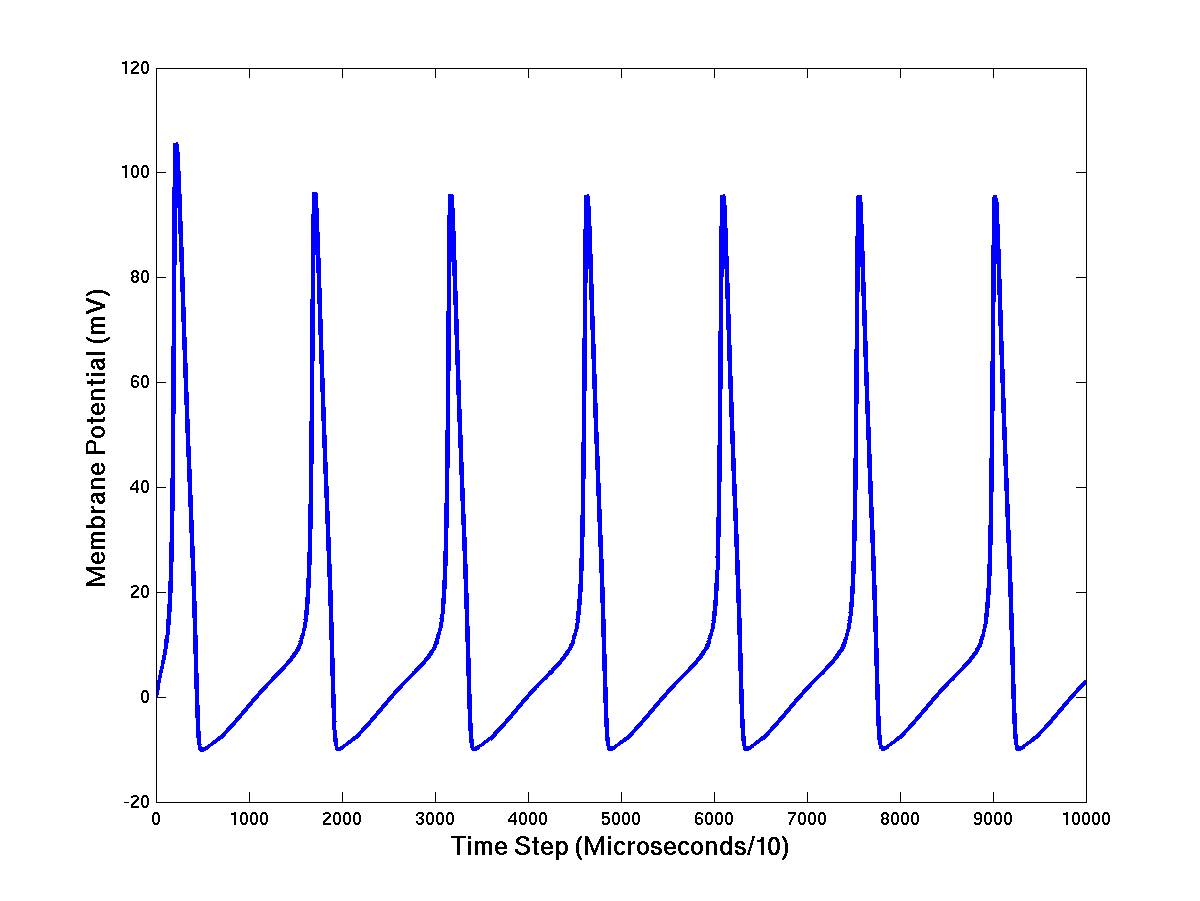
| 04:14, 2 February 2009 | HHSimLoNoise.jpg (file) |  |
75 KB | Carver | Hodgkin Huxley Simulation with Low Noise | 1 |
| 19:07, 10 September 2014 | Stat202Homework5.pdf (file) | 77 KB | Carver | 1 | ||
| 02:11, 13 July 2015 | Stat202Exam1Practice3.pdf (file) | 78 KB | Carver | 1 | ||
| 19:32, 29 January 2015 | Math211 2015S HW8.pdf (file) | 78 KB | Carver | 1 | ||
| 03:02, 1 April 2015 | Math211 2015S HW19.pdf (file) | 80 KB | Carver | 1 |
First page |
Previous page |
Next page |
Last page |